The bonding arrangement of a small organic molecule for which the exact mass is known can be inferred from 1D 1H and 13C and 2D 1H/13C HSQC and HMBC spectra. Samples of 1 mg (FW < 500) of 95% pure material can be routinely identified with a standard suite of NMR spectra acquired in several hours; if a one-to-one correspondence of peaks and atoms is present, straightforward data analysis rapidly yields complete 1H and 13C NMR resonance assignments. For some samples, however, the data may indicate that an atom in a particular bonding arrangement is present as more than one possible peak: such complications can arise from a single chemical species having multiple conformations that are in slow exchange due to bond rotation barriers (e.g. amides) or from different chemical species (isomers, if only a single mass is present). Such samples require extensive data analysis or even additional data acquisition: spectra may be acquired in other solvents, and at different temperatures or magnetic fields, to eliminate the possibility that any of the additional NMR signals might derive from some unexpected contaminating or major species.
Core personnel recently helped BCM Associate Professor Jin Wang and colleagues prove the chemical identity of RT-AM (Figure 1), the acetoxymethyl protected membrane-permeable version of the compound RT that they synthesized as a probe for quantitative real-time imaging of glutathione.
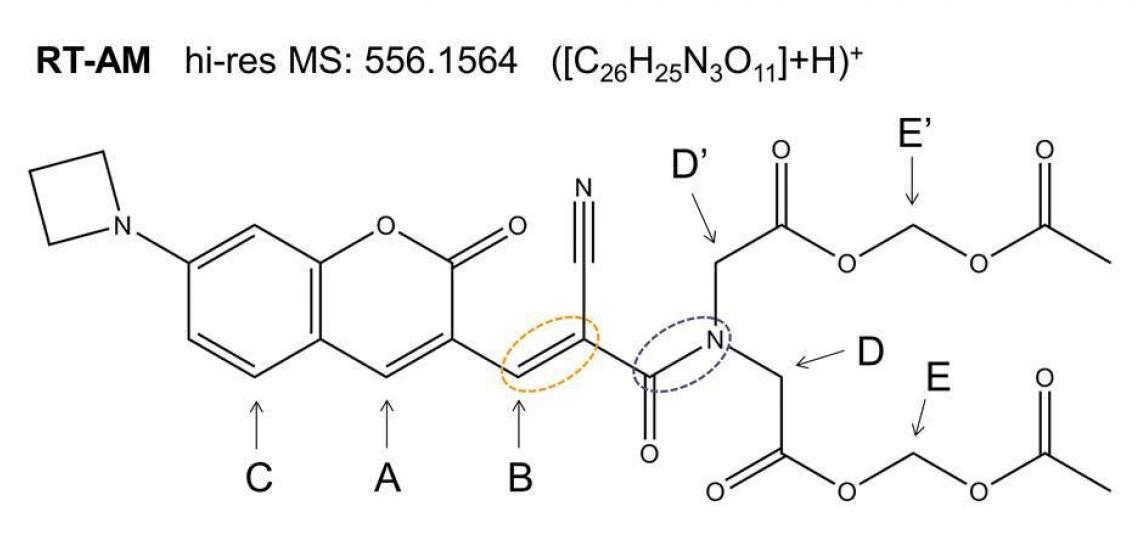
Figure 1. RT-AM is predicted to adopt both the E and Z geometries at the carbon-carbon double bond indicated by the orange oval. Each isomer contains an amide bond (purple oval) expected to show slow interconversion of the amide substituents: atoms D and D’ (and the rest of the substituents) will exchange positions by rotation of the C—N bond.
Exact mass spectra agree with the structure predicted from the synthetic scheme (Figure 1), but a mixture of E and Z geometric isomers at the critical double bond where the reversible Michael addition occurs (red oval in Figure 1) means the 1D 1H (or 13C) spectra will show two sets of resonances (see Figure 2a), which complicates the NMR data analysis. The reversibility of the Michael addition, a key feature of RT that allows rapid kinetics of the probe response to glutathione, enables RT (and RT-AM) to convert between the E and Z isomers, so even pure samples of one isomer will revert to a mixture over time. 2D 1H/13C multiple bond correlations (Figure 2b) nevertheless allow each of the signals in the 1D spectra to be assigned to one isomer or the other. In these 2D spectra, J coupling between hydrogens and carbons located two or three bonds away give rise to correlation peaks at the 1H and 13C chemical shifts, allowing the chemical nature of the neighboring atoms to be identified and thus the bonding arrangement to be deduced.
RT-AM NMR signals can be assigned to distinct isomers (Figure 2a and 2b)
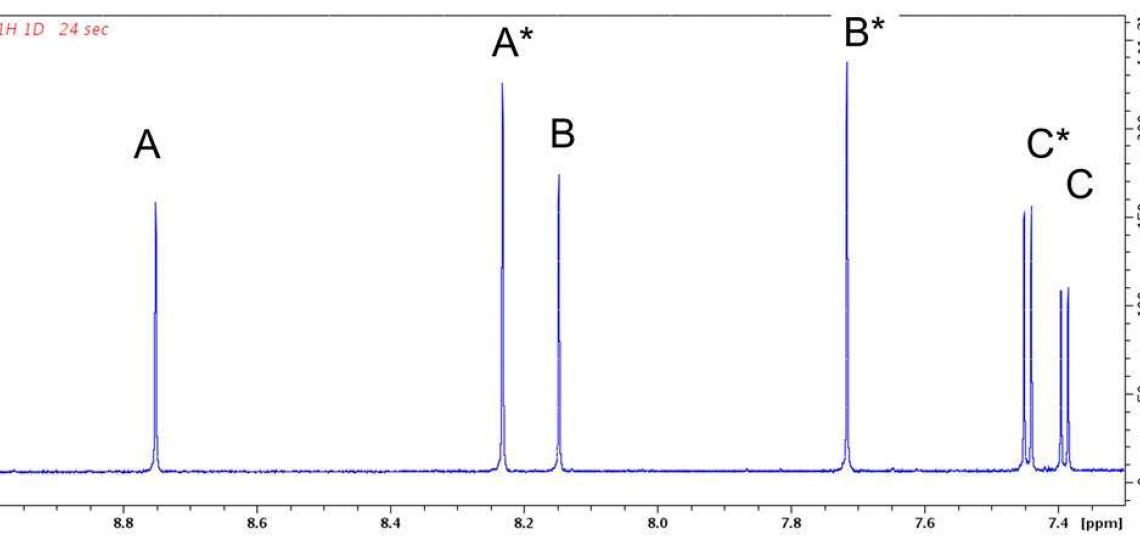
Figure 2a. Aromatic region of the 1D 1H NMR spectrum of RT-AM in DMSO-d6.
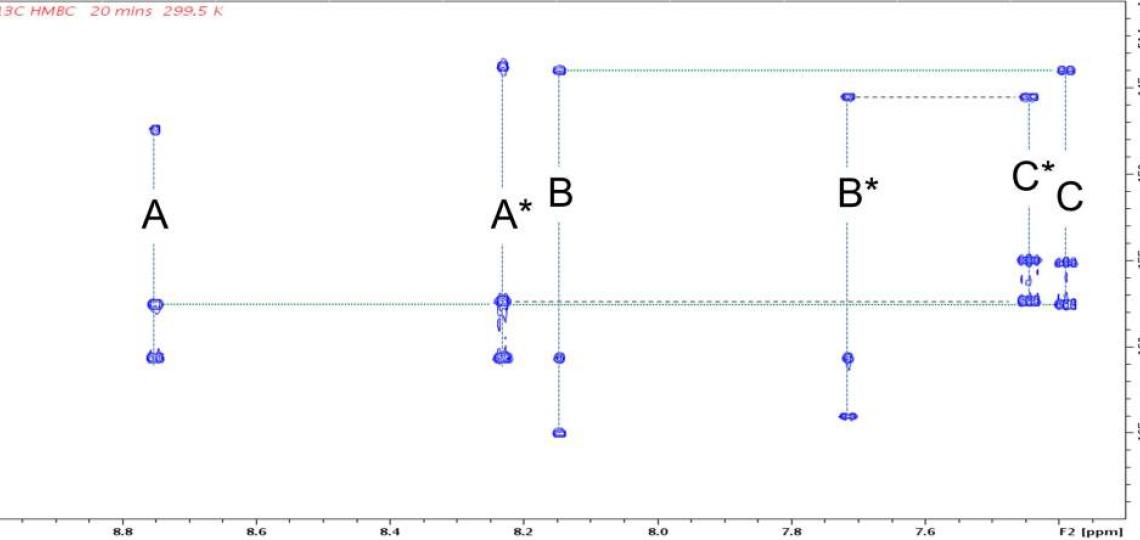
Figure 2b: 2D 1H/13C HMBC peaks correlate signals from the same RT-AM isomer. Each 1H shows correlations at the chemical shifts of 13C atoms two or three bonds away (present at natural abundance, 1.1%). Cross peak pairs at 144.0 ppm (horizontal green dotted line) and 145.6 ppm (horizontal heavy dotted line) show that hydrogens B and C (see Figure 1) belong to one isomer, whereas B* and C* belong to another. Pairs at 157.36 ppm and 157.51 ppm similarly assign A and A* to their respective isomer. These assignments are consistent with the relative intensities of the signals in each set: the ‘starred’ species are present at higher levels than the unstarred. HMBC peaks from other regions of this spectrum allow the entire network of 1H and 13C atoms in a molecule to be inferred.
A second complication in these NMR spectra is slow rotation about the amide bond (purple oval in Figure 1), which affects the line shapes of resonances for atoms on the nitrogen side of the amide bond. Hydrogens D and D’ (Figure 1) will have different chemical shifts because they are in different environments; each is also expected to appear as two peaks in the 1D 1H spectrum because of the E/Z isomers (Figure 3a). Rotation about the amide bond allows the two amide substituents within a given isomer to exchange positions, as demonstrated by positive NOE cross peaks (Figure 3b); the lack of cross peaks between resonances in different isomers indicates that equilibration between the E and Z forms is not detected on a time scale of 400 milliseconds. Rotational exchange about the amide bond occurs at different rates for the E and Z isomers, giving rise to different line widths for the resonances of the two isomers as well as different relative intensities of NOE cross peaks and auto peaks.
Conformational exchange can complicate NMR spectra (Figure 3a and 3b)

Figure 3a: Portion of the aliphatic region of the 1D 1H NMR spectrum of RT-AM.
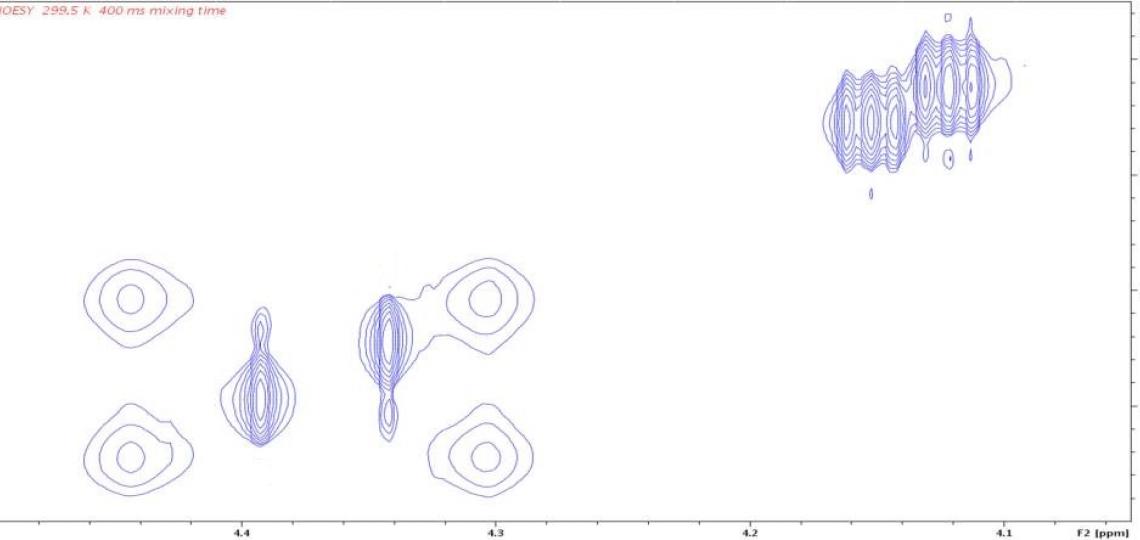
Figure 3b: 2D 1H/1H NOESY peaks identify exchanging atoms. The four peaks at the left in this panel and 3a correspond to hydrogens D and D’ of Figure 1 for the two isomers (with and without asterisk). Differential line broadening occurs because the D and D’ (or D* and D’*) atoms interconvert slowly by amide bond rotation and this rate differs in the E and Z isomers. Each resonance of the 1D spectrum has an auto peak on the diagonal of the 2D NOESY spectrum. Slow conformational exchange (atom D interconverting with atom D’ by occasional rotation of the amide bond) causes off-diagonal exchange cross peaks to appear at the chemical shifts of the exchanging atoms. The cross peak positions show that D exchanges with D’, and D* with D’*. The weak intensity of the D/D’ cross peaks compared to their auto peaks indicate that only a small amount of conformational exchange occurs for this isomer in the 400 ms mixing time of this NOESY experiment.
The effect of conformational averaging on the 1D 1H spectrum is even more dramatic for hydrogens E and E’ of Figure 1: the broad linewidths cause signals for the more rapidly exchanging isomer to collapse nearly to the baseline (Figure 4, top). Cooling the sample from 299.5 K to 269.5 K slows this exchange and reveals the expected four distinct peaks for hydrogens E and E’ (Figure 4, bottom). Conformational exchange can affect the line width and sensitivity of signals in any of the standard NMR experiments used to probe small molecule structure, but by changing the solvent or the temperature one can usually reveal the underlying species present (i.e., the broad peaks in Figure 4 top do not give detectable 1H/13C HMBC correlations but all peaks in Figure 4, bottom do).
The effect of conformational averaging on the 1D 1H spectrum is even more dramatic for hydrogens E and E’ of Figure 1: the broad linewidths cause signals for the more rapidly exchanging isomer to collapse nearly to the baseline (Figure 4, top). Cooling the sample from 299.5 K to 269.5 K slows this exchange and reveals the expected four distinct peaks for hydrogens E and E’ (Figure 4, bottom). Conformational exchange can affect the line width and sensitivity of signals in any of the standard NMR experiments used to probe small molecule structure, but by changing the solvent or the temperature one can usually reveal the underlying species present (i.e., the broad peaks in Figure 4 top do not give detectable 1H/13C HMBC correlations but all peaks in Figure 4, bottom do).
Cooling slows exchange processes and influences NMR spectra
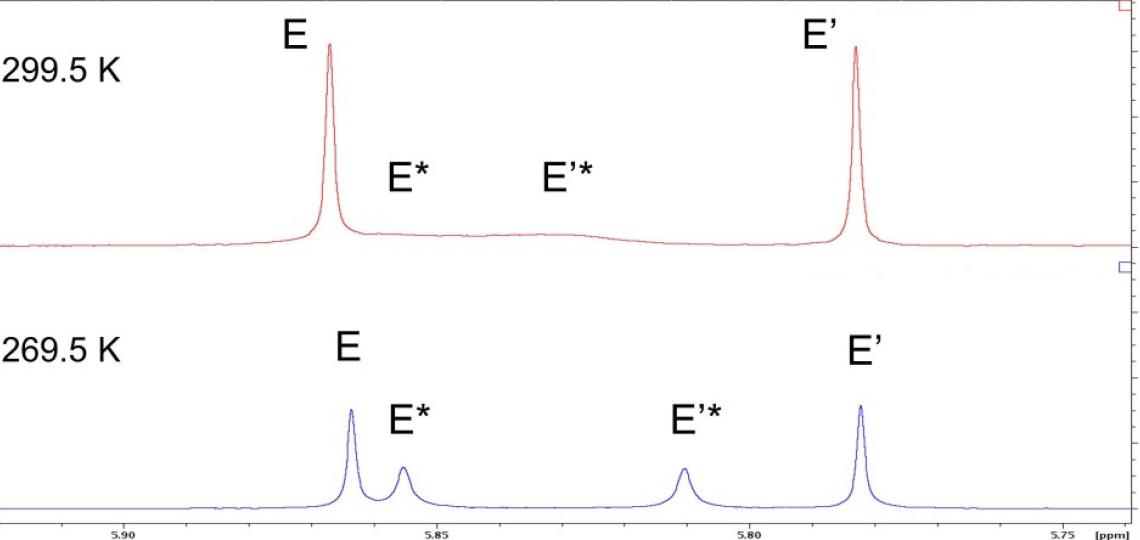
Figure 4: Temperature alters NMR signals of exchanging species. top: the methoxy peaks in the 1D 1H NMR spectrum of RT-AM in CDCl3 at 299.5 K appear as two narrow singlets (E and E’) for one isomer and two broad singlets (E* and E’*) for the other isomer that are poorly resolved and barely detectable. bottom: At 269.5 K, the four expected peaks are readily detected, though line width differences are still observed.
Despite the presence of one configurational heterogeneity and one conformational heterogeneity on the millisecond to second time scale, a careful analysis of the 2D HSQC/HMBC one- and multiple-bond correlations identifies a complete set of resonances for the expected E and Z species in a 4:3 ratio (Figure 5), and with all NMR peaks accounted for, we can conclude that the sample comprises only the expected RT-AM E and Z isomers.
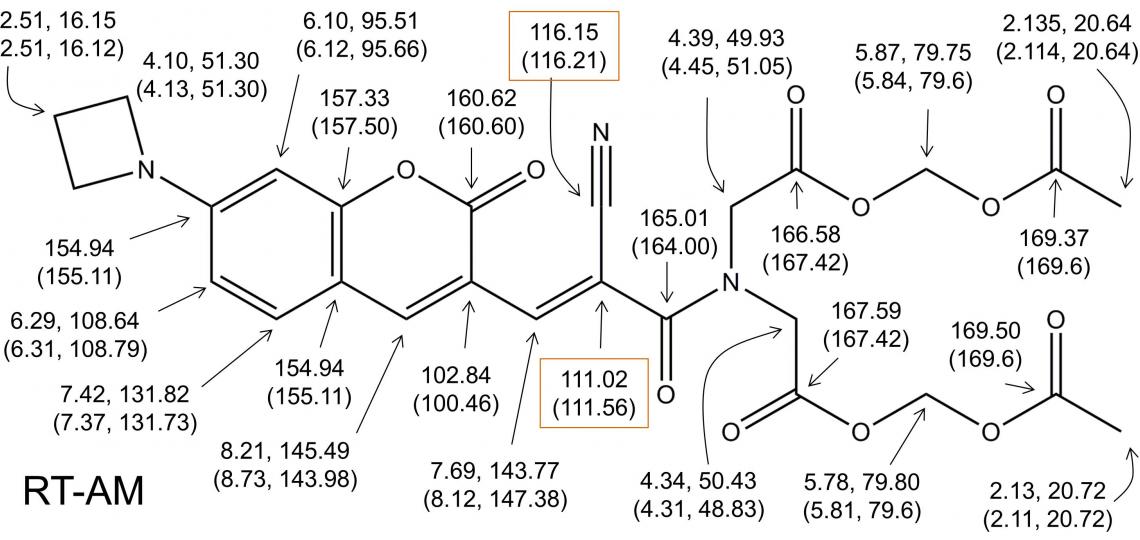
Figure 5: Complete 1H and 13C resonance assignments for RTAM.
The predicted structure of RTAM is confirmed by detection of all expected 1H/13C multiple bond correlations for the major (and minor) isomer. The assignment of every 1H and 13C resonance in the spectra establishes that no other species is present. The boxed chemical shifts were assigned to the indicated atoms on the basis of 2JCH and 3JCH relative magnitudes, and could possibly be reversed. A 13C-13C COSY that identifies adjacent carbon atoms could resolve this ambiguity if needed.
X Jiang, J Chen, A Bajic, C Zhang, X Song, SL Carroll, ZL Cai, M Tang, M Xue, N Cheng, CP Schaaf, F Li, KR MacKenzie, AM Ferreon, F Xia, MC Wang, M Maletic-Savatic, and J Wang, Quantitative real-time imaging of glutathione, Nat Commun. 2017, 8:16087.
Contacts:
Kevin MacKenzie, Ph.D.
Kevin.MacKenzie@bcm.edu
281-773-2672


