


The Office of Accreditation and Education Effectiveness has developed Power BI Data Dashboards for the Baylor community and the public with interactive access to key institutional metrics across Baylor College of Medicine’s academic programs.
Dashboards on Admissions, Enrollment, and Degree Awarded present an overview of Baylor’s learner population and educational outcomes. These are followed by Student Achievement dashboards focused on graduation rate, retention rate, time to degree, first-time pass rates, and job placement – metrics assessed to monitor educational effectiveness and demonstrate compliance with SACSCOC Standard 8.1. The Accreditation Dashboard offers an overview of specialized accreditation and academic program reviews.
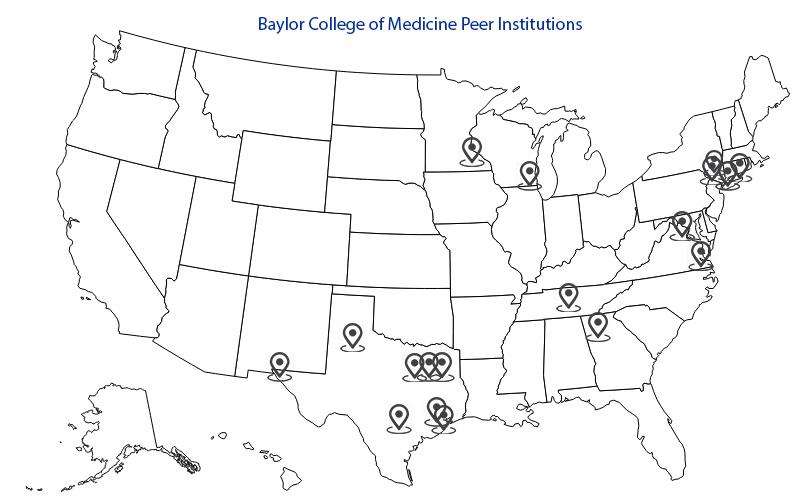
Additionally, we highlight how Baylor compares to peer institutions by offering dashboards on enrollment, student-to-faculty ratio, programs offered, and degrees awarded. For more information about our peer institutions, please visit the peer institutions webpage.
At Baylor College of Medicine, we prioritize data-driven decision-making and continuous improvement. If you’re unable to find the data you need on the dashboards or other Baylor webpages, please visit the data request webpage for assistance. Whether you’re a faculty member assessing programs, an administrator planning resource allocation, or a researcher, studying higher education trends, our team can support you in obtaining the necessary data.
Read instructions on how to navigate the dashboards. Or, view the video tutorial.

Admissions
Explore admission and yield rates, student demographics, and geographic representation to gain insight into the selectivity of BCM's incoming classes.

Enrollment
Based on the IPEDS Fall Enrollment Survey, this dashboard presents enrollment trends across schools and programs, including both degree-granting and non-degree granting programs, and shows where our students come form worldwide through the residency and citizenship map.

Degree Awarded
Explore the trends in degrees awarded and non-degree program completions across schools and programs to gain insight into Baylor's educational impact.

Graduation Rate
The percentage of students who completed their program within 100% and 150% of the published time for the program or based upon benchmarking data from peer institutions. Graduation rates are calculated both with and without Leave of Absence students and are broken down by student demographic groups.

Retention Rate
The percentage of students who are admitted to and enroll in a particular cohort during an academic year and continue their original program studies in the following academic year. Retention rates are disaggregated by gender, race/ethnicity, citizenship, and award status.

Time to Degree
The duration it takes for a specific graduation cohort to complete their degree requirements and graduate. This duration is the total time spent in the enrolled program, excluding any periods when the student was not enrolled (referred to as registered time to degree). The report also presents the counts, mean, minimum, maximum, and standard deviation of time to degree, and is broken down by student groups.

First-time Pass Rate of National or Licensure Exams
The Percentage of first takers of certifying examinations who successfully pass the exam on the first attempt. The exams include ABGC Certification, DNP National Certification, PANCE, USMLE Step 1, and Step 2 CK. Pass rates by student groups are also presented.

Job Placement Rate
All students of a defined cohort employed in their field of training or related field upon graduation. Data visualization includes employment by state, specialty program, and student demographic groups.

BCM Accreditation and Academic Program Review
This dashboard provides an overview of the specialized accreditation and academic program reviews. It displays the number of degree programs (14) and accreditation agencies (9), along with details of each program, including the school, program name, review type, accrediting agency, and dates of the last and next reviews.
Peer Institution Data
Peer Institution – Degree Awarded
Compare the number of graduate degrees awarded by BCM and its peers. This visualization helps see the trends over the past three years.
Peer Institution – Enrollment and Student-to-Faculty Ratio
Explore detailed student enrollment statistics by degree level, attendance status, gender, and race/ethnicity. This dashboard also provides data on the number of full-time instructional faculty and student-to-faculty ratio.
Peer Institution – Program Offered
Get an overview of the academic programs offered by BCM and its peer institutions. This dashboard uses the most recent Classification of Instructional Programs (CIP) from 2020 to facilitate a comparison across different geographic levels across time.
Peer Institution – Academic Library Services
See how BCM’s library resources compare to peers. This dashboard shows key data from the IPEDS Academic Libraries Survey, including total collections, digital books, databases, expenditures, and usage.