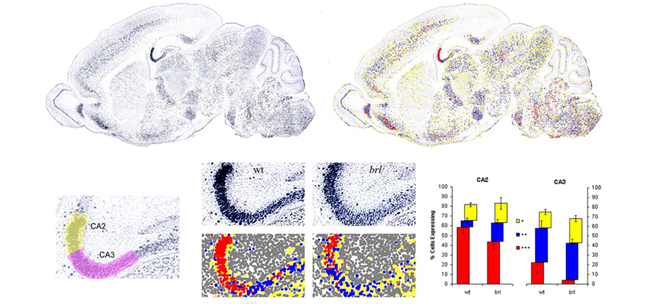
We can assist with quantification (cell counts and expression levels) of non-fluorescent ISH using software developed for the core by Dr. James Carson. An example is shown in Figure 6. For details see Carson JP et al. (2005) J. Microsc. 217:275-281.

Top panel: Left: sample expression pattern of Ly-6/neurotoxin homolog (Lynx1) in a sagittal section of adult mouse brain. Right: automated intensity analysis of the expression pattern, cells expressing high levels of Lynx1 are shown in red, medium expressing cells in blue and low expressing cells in yellow.
Lower panel: Quantification of differences in Lynx1 expression strength between wildtype (wt) and barrelless (brl) mice in the hippocampus. Left: hippocampus CA2 region marked in yellow, CA3 region in purple. Middle: close up view of the Lynx1 expression pattern in the hippocampus in wt and brl mice and below the respective intensity analysis. Right: plot of percentage of cells expressing Lynx1 at high (red), medium (blue) and low levels (yellow). The automated intensity analysis was performed over three different sagittal sections from wt and brl mouse brains. The data clearly indicate a decrease of expression strength in the hippocampus of brl mice compared to wt.


